So you’re about to take your statistics exam and you’re experiencing stress and anxiety of what you’re about to experience;
It is important to set a few ground rules, that’ll help you go through this successfully regardless of the field your test is on – whether it’s descriptive statistics, or inferential statistics or hypothesis testing or probability, or regression analysis, or even operation research, or survival analysis.
Weather you can use your ti-83 or ti-84, or you can use SPSS or StatCrunch, or whichever statistical software, it’s always important to remember a few ground rules, that’ll probably be useful for each and every statistics exam you’d take, or even math exam, whether it’s Calculus or real analysis or Linear algebra – the following ground rules will apply to all-
Always Stick to your formulas
In mathematics in general and specifically in statistics, the formulas are super important, so be sure to stick the formula no matter what you do.
The formula is the key to understanding basically how everything is working.
Here and there, there are better and more adequate versions of a certain formula, either related to a specific case, or in general, but there’s always the possibility to work with the primal formula.
An example to that would be the general formula for expected value (E(x)=∑x*P(x)) compared to the specific expected values formulas for the various discrete probability distributions like the geometric distribution, the Poisson distribution, the Hypergeometric distribution and of course the Binomial distribution mentioned earlier.
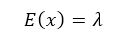
That is even more conspicuous for the variance – the general formula for the variance is not something that is being used in a day to day usage, but the more adapted formula (using the expected value as part of this function) and specifically also the variance values for all those distributions discussed earlier.

Use sketching and plotting as much as needed
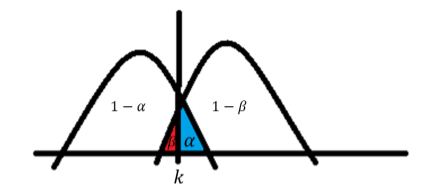
Both mathematics and statistics could be very abstract and unrelated to many people. Generally everything gets less abstract with sketching. Especially relevant in hypothesis testing but also in simple linear regression and even in Combinatorics although it can be very challenging to cover all the possibilities.
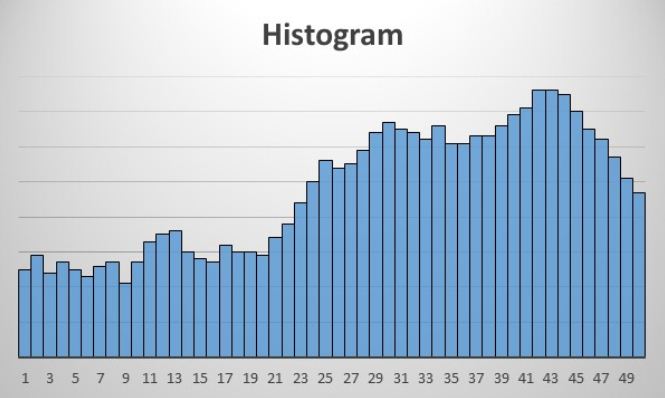
Moreover, when dealing with descriptive statistics apart from the frequency tables and the measures of central tendency and dispersion, the students are expected to exhibit the data using various kinds of plots like a bar chart, a pie chart, a histogram, a boxplot, a stem and leaf plot and more.
Try to check your solution from several directions-
There are many fields in statistics that a solution obtained in one way could be obtained with another way or even more than one alternative way.
A great example for that is also hypothesis testing, in which a conclusion can be drawn using the p-value approach or the critical value approach or even in certain cases – using the confidence interval.
Follow your intuition-
Even if at first you feel like you don’t have any intuition about it, trust me, with time you’ll start to develop that intuition, as long as you keep working according to steps 1, 2 and 3, your intuition will follow;
You’ll understand you have intuition when you deal with Binomial distribution question and out of nowhere you’ll understand that the highest probability achieved in the Binomial probability is when the number of the calculated events is the same as in the expected value (E(x)=n*p).

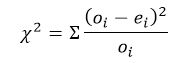
You’ll understand you have intuition when out of nowhere you’ll figure out that in Chi-square test for independence of variables, when both variables have 2 categories, the numerator value is constantly equal for all parts of the statistic value.
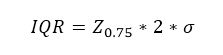
You’ll understand you have intuition when suddenly you’ll realize that you can use the symmetry attribute of the Normal distribution to find some of the probabilities like IQR (interquartile range) without actually need and use the mean of the distribution.
1 Comment
Tiffany a. · August 27, 2020 at 4:06 pm
Thank you for that valuable information!!