Let’s assume we have this table:
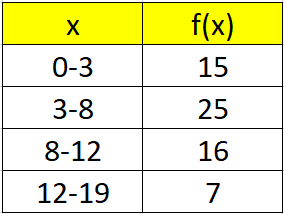
At first, we’d build an aiding table to assist and simplify all the calculations;
There’s the table:
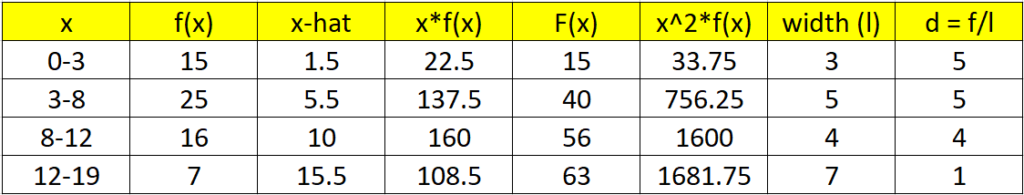
The mean is calculated as it is calculated for discrete tables.

The mode is usually the mid-point of the class with the highest density (d); in some cases, it has a specific formula, but generally, it’s just the mid-point of the class with the highest level of density;
In this case: the highest density is for the 1st and the 2nd classes, so the we have 2 modes: 1.5 and 6.5.
Median:
Usually, the median is calculated using this formula:

At first, we need to decide, what is the relevant class for the median, and then – we have to implement the formula on the specific interval.
In our case, there are totally 63 respondents, so we’re looking for the value positioned at the 31.5th position.
This can be found at the 2nd interval (3-8).
That is the relevant value:

So, the interpretation for the result we got, is that 50% of the respondents has a value of 6.3 or less, and the rest of the 50% percent, have a value of 6.3 or more.
As for the standard deviation – the calculation is basically identical to the discrete case:

As for the variance – the calculation is identical, only without the root;
The inter-quartile-range (The IQR):
The IQR is the difference between the 25th and the 75th percentiles, or in other words: the mid 50% of the distribution.
That’s the calculation:

