In statistics, the chi-square test is a popular method for comparing observed data with expected data, and determining whether the differences are statistically significant or just due to chance. The test is widely used in a variety of fields, including biology, psychology, sociology, marketing, and more.
In the context of decision making, the chi-square test can be an extremely powerful tool for making informed decisions based on data analysis. By using the test to compare observed data with expected data, decision makers can gain insight into the underlying relationships between variables and identify any trends or patterns that may be influencing the outcome.
For example, suppose a marketing manager is interested in determining whether a particular advertising campaign has been effective in increasing sales. By using the chi-square test, the manager can compare the observed sales data with the expected sales data (i.e., sales data from a period before the campaign), and determine whether the difference is statistically significant. If the test indicates that the difference is significant, the manager can conclude that the advertising campaign has had a measurable impact on sales.
However, it is important to keep in mind that the chi-square test is not a perfect tool, and there are some potential limitations and pitfalls to be aware of. For example, the test assumes that the data are independent and normally distributed, and can be sensitive to small sample sizes or low expected frequencies. In addition, the test only measures the strength of association between variables, and does not necessarily prove causation.
Overall, while the chi-square test can be a powerful tool for decision making, it is important to use it in combination with other methods and to be aware of its limitations and assumptions.
The chi-square test is a statistical method that is commonly used to analyze categorical data, such as survey responses or counts of items in different categories. The test measures the difference between observed data and expected data, and determines whether the difference is statistically significant or just due to chance.
Jamovi is a free and open-source statistical software package that can be used to perform a wide range of statistical analyses, including the chi-square test. The software is designed to be user-friendly and accessible to both novice and experienced users, and features a point-and-click interface that makes it easy to enter data, run analyses, and interpret results.
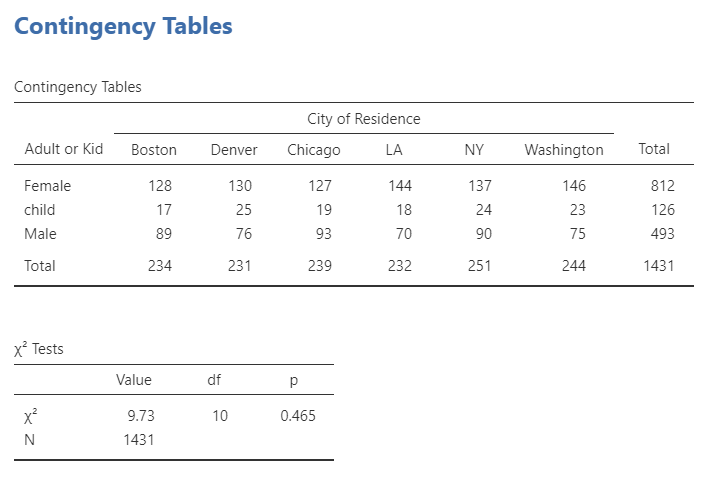
To perform a chi-square test in Jamovi, you first need to enter your data into a spreadsheet or data editor. You can then select the appropriate test from the “Analyses” menu, and specify the variables and settings for the test. Jamovi will automatically calculate the test statistics and p-values, and provide a range of output options, including tables, graphs, and plots.
One of the benefits of using Jamovi for statistical analysis is that the software provides a range of features and tools that can help you interpret and visualize your data. For example, you can use the software to generate frequency tables, bar charts, and other graphical displays that can help you identify patterns and trends in your data. Jamovi also provides a range of tools for data cleaning and preprocessing, which can be especially useful when working with large or complex datasets.
In summary, the chi-square test is a powerful statistical method for analyzing categorical data, and Jamovi is a user-friendly software package that can be used to perform the test and interpret the results. By combining these tools and techniques, researchers and analysts can gain valuable insights into the relationships between variables and make informed decisions based on data analysis.
