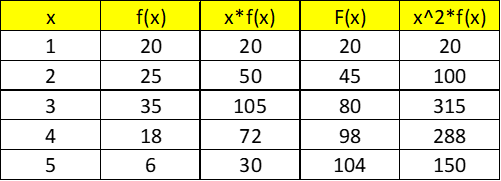
Assume this is the frequency table we’re given:

In this example, “x” is a variable representing something, and f(x) is the discrete frequency vector, of which each element is attributed to the according x value. In other words – we have 20 elements or units or subjects that their value is 1, 25 subjects’ that there value is 2, 35 subjects with the value 3, 18 subjects with the value 4 and 6 subjects with the value 5.
In total, we have 20+25+35+18+6 subjects or elements, that add up to 104 subjects in total.
The mean, median and mode are called central measures and the standard deviation, the variance and several more measures, are called measures of dispersion.
To find those measures, let’s use the following table, with a bit more aiding columns:
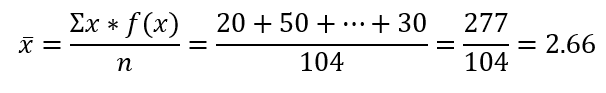
Mean:
The mean (or the average) is probably the most common measure and most widely known. We need to distinct between the two types of mean: the arithmetic mean, and the geometric mean (AKA weighted mean). There’s also the harmonic mean, but in this article, I’ll discuss the only the geometric mean.
Calculating the Mean:
Median:
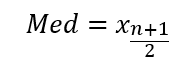
The median is the value that is positioned in the exact middle of the distribution. With discrete distribution, it has two formulas- one for an odd number of observations, and the second is for an even number of observations.
For odd n’s:
For even n’s:

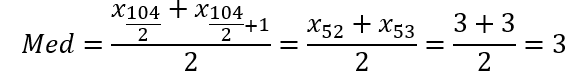
In our case: we need the even formula, because n=104.
So, that is the relevant calculation for this case:
Mode:
The mode is the value of x, with the highest number of observations, which means, its f(x) value is the highest. There’s also a possibility for more than one mode (for instance, for this set: {1,1,2,2,3,4,5}) or for no mode at all (for instance, for this set {1,2,3,4,5}).
In this case, the mode is just 3, since its number of repetitions it the highest.
Mid-Range:
The mid-range is the mid point between the maximum value of the distribution and the minimum value of the distribution. In our case: between 1 and 5.
That is the calculation:

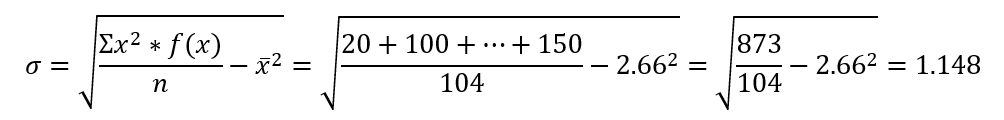
Standard deviation:
The standard deviation (or SD), is a measure of dispersion, and it is also commonly used in this case and many others (like inferential statistics, normal distribution and many more). For standard deviation, one also need to distinct between the population’s standard deviation, and the sample’s standard deviation.
That is the calculation in this case:

